Written By: Alexis Berndt, PharmD, BCPS; Ryan Cello, PharmD, FASHP
Edited By: David Ngo, PharmD, BCPS, MBA; Ben Moore, PharmD, MHCI; Killian Rodgers, PharmD, MS
Developing metrics and key performance indicators (KPIs) can be a daunting task for any pharmacy leader or analyst, but is crucial to developing analytical products that actually drive change.
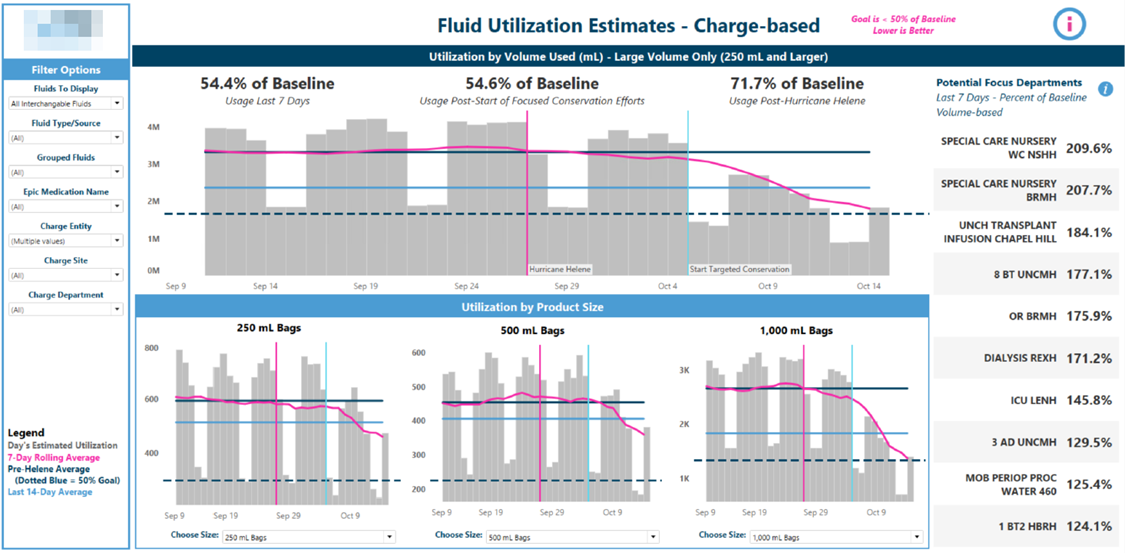
In this post we dive into how to approach the development of metrics and KPIs using the example of the 2024 Hurricane Helene IV fluid shortage. This event forced many health systems across the country to quickly develop and deploy metrics that tracked their utilization and the success of conservation efforts. Below we present how one health system, UNC Health, approached this and the questions that should drive any metric or KPI development.
What problem are you solving and why?
In this case, the main problem we were trying to solve was figuring out how much supply of fluids we had on hand and when we’d run out. While originally phrased as wanting to know “days on hand” we quickly realized it was much more complex than this and involved needing to know supply, consumption, and impact of mitigation strategies.
Additional Commentary: As noted, when approaching a request for data, consideration must be taken as to the breadth of impact and supporting information that will be critical in answering the original question--in this case, the additional element of usage. Approaches for defining metrics will depend too on the scope of use – enterprise dashboards being used across a number of facilities will need to have broader definitions than those built for use by single sites or teams.
A helpful intake tactic is to confirm:
· The decision the metric will drive
· The operational audience
· How quickly the data must be available
Clarifying these items up front helps ensure the build team is solving the right problem before development begins. Next, consider who will use the data and how it will be applied across stakeholder groups.
Who will use this data and how?
While it was primarily pharmacy executive leadership asking for this information, we realized that it would be utilized broadly by pharmacy, nursing, supply chain, and providers. The challenge was that each group would utilize it differently and need to be able to filter in different ways. For example, supply chain leaders wanted to know total use across a hospital whereas nursing leaders were thinking more on a unit scale. To accommodate, we designed the dataset to be robust and have multiple different views to meet the various needs without being too cumbersome of a data set.
Additional Commentary: This early stakeholder mapping step helps prevent multiple teams from building separate “versions of the truth” for the same metric. As noted above, assessment revealed the scope to include additional key stakeholders and have broader application. Additionally, consider whether any of the current stakeholder groups already have access to some or all of the data you will require. If so, you can often build off existing reports, data extracts, or workflows rather than starting from scratch.
It is also important when assessing a new request to consider how this new metric is aligned with other organizational imperatives or goals and the impact it may have on the assessment of goals and end user groups. If a directional improvement is needed, consider how accountable end users will access meaningful data to drive change. This includes setting expectations for what actions will be taken when targets are not met. Therefore, in addition to access to meaningful data, expectations for use of the data should be clear; this is particularly important in broad use cases. Consider the following questions when building governance around your initiative:
§ What strategies and structures work for my organization? Consider standard work when developing your program.
§ Who will be accountable for utilizing the data? And, if a multidisciplinary approach is needed, are teams aligned on this imperative?
§ Is the application/use case/goal/objective clear to end users? Do end users understand why it is important to invest time in this initiative?
§ What is your plan for helping key stakeholders identify strategies for improvement? And, what are the requirements when not meeting goals?
How is the data accessed and operationalized?
Because of the large range of stakeholders, we needed to ensure enterprise-wide access. While we typically try to right-size access to just the team members that need it, this was a good example of a case where broader access was needed. We also knew that the data would need to be updated daily as soon as possible. We worked closely with our Enterprise Analytics and Data Science team to make sure anyone across the enterprise could access the dashboard and to prioritize the query that updates it so it ran early each day. This helped get data into the hands of the right people as soon as possible each day so they could begin taking action.
Additional Commentary: Consider data accessibility for key stakeholders:
· Do any current stakeholder groups already have access to some or all of the data required (even in partial form), and can you build from those existing reports, extracts, or workflows rather than starting from scratch?
- Consider how challenging access is; can it be embedded into typical workstreams or existing data tools? Is automation available? And, will there be alignment across the organization in data presentation?
· What new data sources or integrations (if any) are required to support the KPI, and can refresh/distribution be automated at the frequency needed for action?
· Consider how often data will need to be accessed to drive improvement and clarify that expectation (i.e., static report, dashboard)
· Consider the format for data dissemination (i.e., team meetings, posted flyers, etc.)
· Consider if additional supporting data will be need and if those capabilities can be embedded into your data model as described in the example above (i.e., drill downs)
· Consider succession planning; can new key stakeholders be easily oriented and will they understand the objective? If not, what steps need to be put in place to ensure continued momentum and accountability?
· In urgent situations, consider interim access pathways (e.g., a time-limited daily snapshot or controlled distribution) while the enterprise dashboard is being built, with clear labeling of timestamp, definitions, and limitations.
How was the dashboard developed?
We had existing shortage dashboards that we used some basic principles from to build this one, such as reporting usage averaged over the past seven days. However, since we were working with all of our sites, many of which did not have managed inventory, we needed a more universal solution. We worked closely with pharmacy clinical leaders, supply chain, and executive leadership to identify what would be the biggest impact to them. In this case, due to the sudden onset of the shortage and significant implications, we knew speed was crucial and mattered more over perfection. We prioritized the solution that would get actionable data into users hands quickly, and fine tuned from there. This is in contrast to more longitudinal KPIs where we go through many rounds of consensus building and end user testing.
Additional Commentary: In this example the approach to developing the data tool was impacted by the speed at which the KPIs were needed. Using existing tools, as shared here, can increase your speed to end result. As you approach new KPI requests consider how existing tools may be leverage as a springboard for new content. Consider the following for your data tools:
· What tools exist that may answer this question and can they be modified to support this new KPI (consider redundancy and potential conflict)?
· What is the lift to create something new, considering the data source?
· What will ongoing maintenance of data look like and what person resources will be needed? Is automation possible?
· Where else might this data be sent, shared, or reused (e.g., emails, reports, huddles, executive updates), and how will you prevent conflicting versions as it spreads?
· What is the life cycle of such data (considering retirement and update frequency and ongoing resources for maintenance)?
· As urgent “speed-over-perfection” solutions stabilize, plan how you will formalize definitions, document assumptions, and transition the tool into a sustainable enterprise asset.
Conclusion: Continue to (Part 2- Dashboard Build, Implementation and Maintenance) to follow this example and others through the process. Thank you to Killian Rodgers, PharmD, MS, for the impactful insights and examples provided.